Zabbix - Getting Started
-
@anonymous If you are not seeing any graphs under Monitoring -> Graphs ->

Then you will probably need to go into Configuration -> Hosts, then click on a host, and have a look at the Templates tab.
-
Does it take some time? I have (45) under graphs.
-
Under Monitoring > Graphs it says "No graphs found."
-
I have the (Template OS Windows) on this server
-
Found Them. Can I show one them one graph at a time?
-
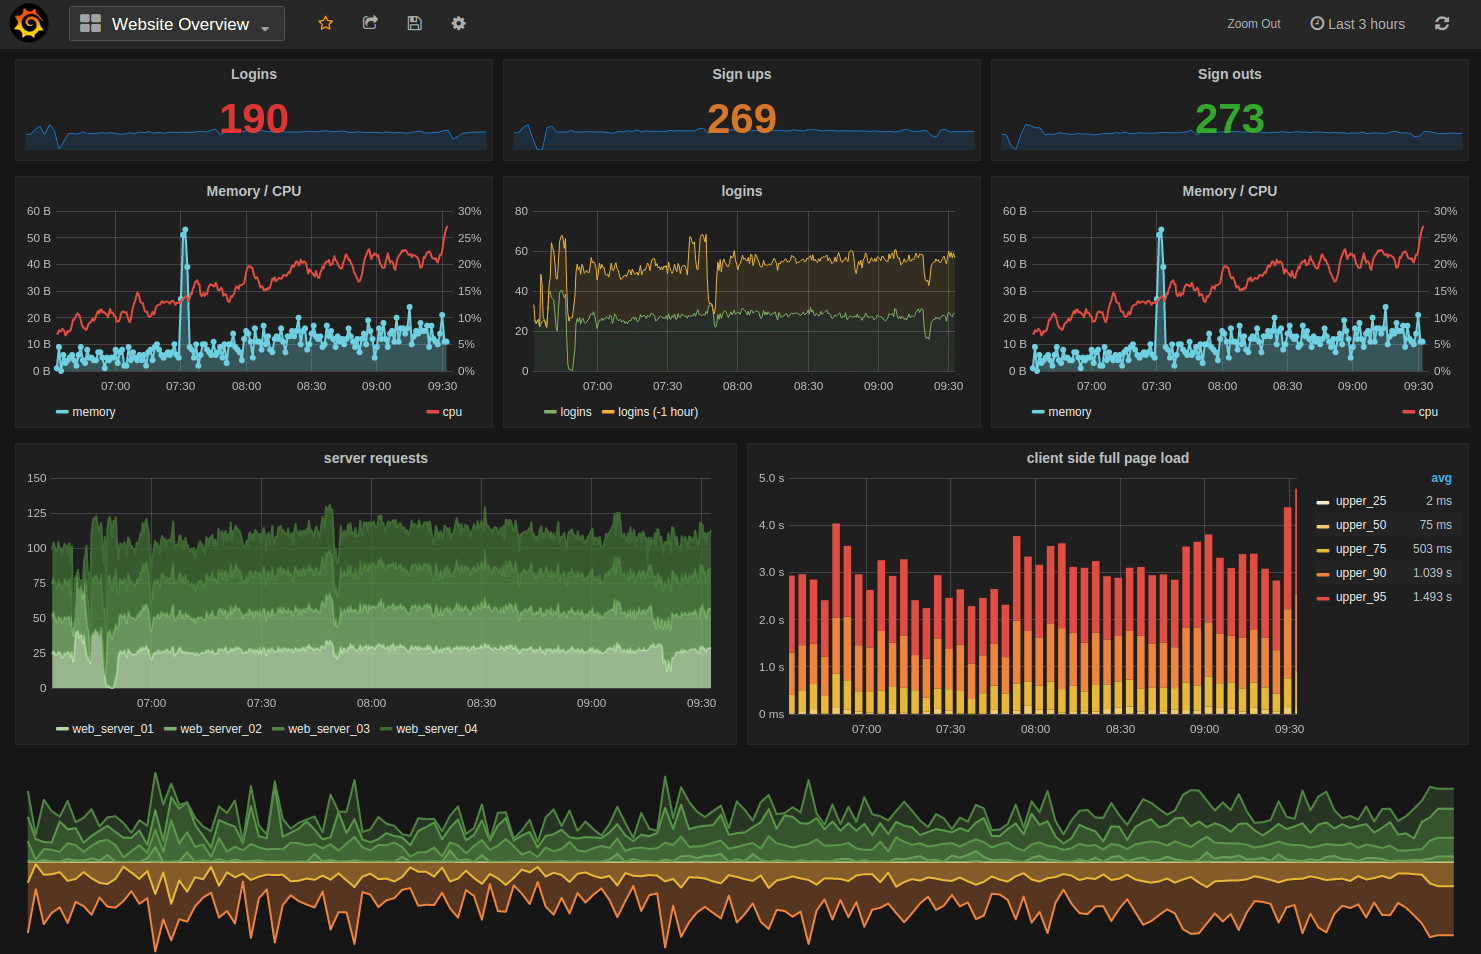
I've never seen pretty graphs in it. Ugly ones, yes. But it is an alerting system, not a capacity monitoring one. It's a bit different than, say, Grafana.
-
@anonymous You can show them one at a time, or make a "Screen" and show multiple graphs (even from different servers) at a time.
-
Anything that has nice graphs like ELK?
-
@scottalanmiller said:
I've never seen pretty graphs in it. Ugly ones, yes. But it is an alerting system, not a capacity monitoring one. It's a bit different than, say, Grafana.
Yes, the graphs are generally ugly, but they look better than graphs made by a cat.

-
@anonymous said:
Anything that has nice graphs like ELK?
Grafana
-

-
@scottalanmiller There is also a plugin for Zabbix that will pull the data from Zabbix into Grafana.
-
@dafyre Oh nice.
-
@scottalanmiller I haven't used it yet, but now that I have some extra server capacity and a zerotier network, I'll have to give it a go, lol.
-